Introduction to Nsight Systems — Nsight Compute
In this article, I will provide a brief introduction to Nsight Systems and Nsight Compute, giving you an overview of which tool to use for your specific needs.
Please note that this article serves as a high-level introduction to these two tools and does not delve into every detail. Therefore, the content below provides an overview of what to pay attention to, while in-depth explanations, debugging, and optimization will be covered in future articles.
Nsight Systems — Nsight Compute
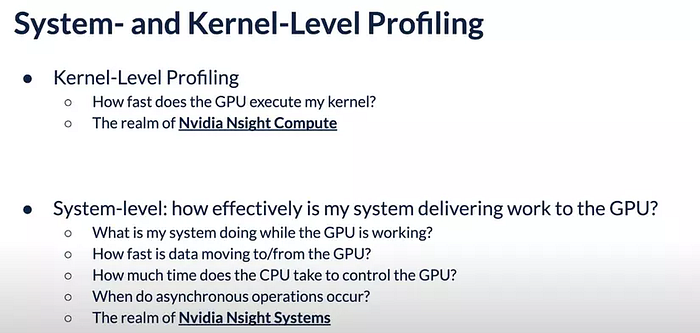
Before we go through these two tools, let me give you an example to make it easier for you to understand. When you go to the doctor for a regular check-up, you will first have a general check-up. If everything is fine, then you can leave. But if there is a problem (for example, with your heart or lungs), then you will need to have a more detailed examination of the parts that are not working properly. In this case, the performance of our code is similar to our health. First, we will use Nsight Systems to check our code overall to see if there are any problems (for example, with the functions or the copy data). If there are, then we will use Nsight Compute to identify the problem in the function/copy data so that we can optimize and debug it.

As you can see in the figure, we will start with Nsight Systems (general check-up) and then move on to Nsight Compute (detailed analysis of the kernels, also known as functions on the GPU). It is important to note that I will not be covering Nsight Graphics because it is for the graphics and gaming industry. However, you should not be disappointed because the metrics are very similar to those of Nsight Compute.
One thing to keep in mind is that these two tools, Compute and Systems, are ONLY for programs that use GPUs to run. That is why in this series, I will only be showing how to use them for parallel programming or Deep Learning models.
Nsight Systems
As you can see in the figure, Nsight Systems is first used to analyze the program. So, what specifically do we analyze here?
1. Time/speed/size when transferring data from the host to the device and vice versa


Based on the three images above, we can see that we can improve the copy from the host to the device.
2. Next, we can look at an overview of our kernel (kernel name: mygemm)
The metrics that we will need to focus on for analysis are: Grid/block/Theoretical occupancy
Summary: After the general check-up, we see that we can improve the code in two areas: copy data and kernel.
Nsight Compute
After confirming that the two problems to be addressed are data copy and kernel, we will use Nsight Compute to analyze in more detail what the problem is.
1. First, the “summary” will show us where we are having problems and how to solve them (I will not go into too much detail here, but I will provide a brief explanation).

As you can see in the figure, we can improve three things, including two that I have already analyzed above:
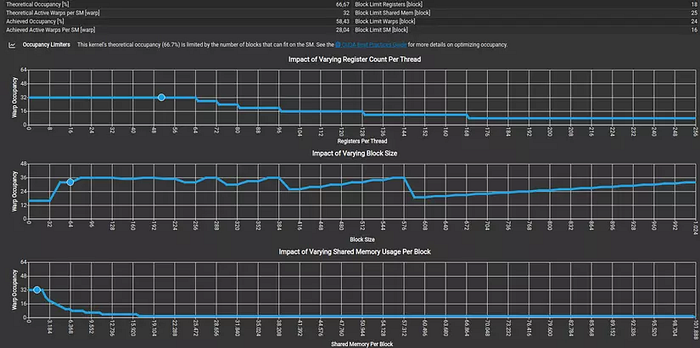
- Theoretical warps speedup 33.33%: You will notice that in the kernel overview figure, the Theoretical occupancy is 66.66%, which means that we can improve it further (in theory, it can reach 100%).
- DRAM Execessive Read Sectors: This means that our memory allocation and organization is not optimized, which leads to problems with read/write during data transfer. Source
2. Next, the “Source” will show us the line of code that is performing the heaviest work (consuming a lot of time/memory).
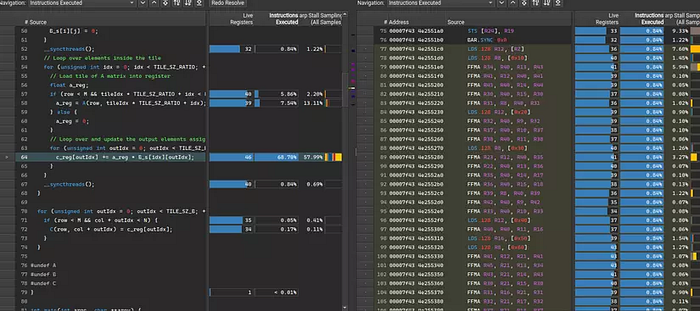
3. The “Detail” is also the most difficult section and contains the most information that needs to be analyzed. The Detail contains a lot of information, but we will focus on the following:
- GPU Speed of Light Throughput


- Memory Workload Analysis
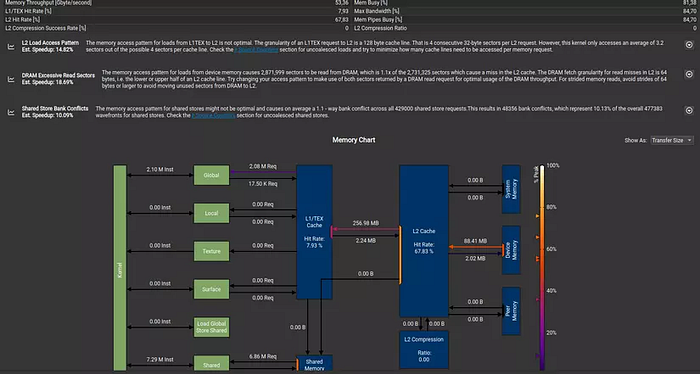
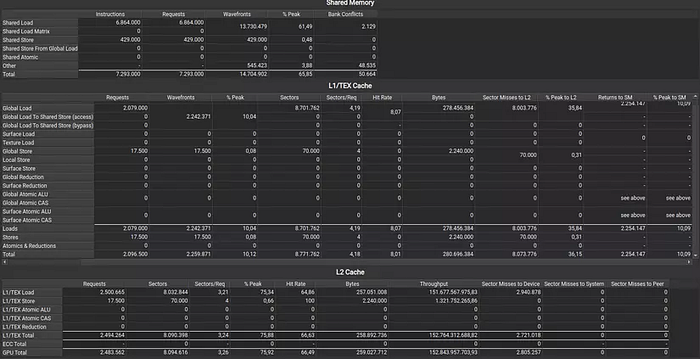
- Scheduler Statistics
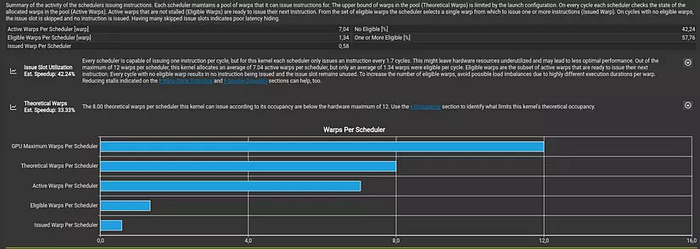
- Occupancy
Summary
After reading this article, you should have a good idea of the usefulness of Nsight Systems and Nsight Compute. In the following articles, I will go into more detail.
If you love this post, please give me a star on github
